Project
SPIDER
Website: debugging.studio →
Overview
When programmers debug, they form hypotheses, investigate possible causes, make changes, encounter errors, and revise their understanding of the problem. Once the bug is fixed, however, much of that process disappears: the final code preserves the solution, but not the investigations and decisions that produced it.
SPIDER (Scaffolding Problem-solving Process with Interactive Debugging Representations) explores what becomes possible when that debugging process is made visible and persistent. SPIDER automatically captures a programmer's work as they debug and represents it on an interactive canvas, allowing them to revisit earlier states, organize their debugging history, annotate their thinking, and share that history with others.
Design Rationale
SPIDER was originally designed as a VS Code extension so that it could fit directly into a programmer's existing workflow. During early paper prototyping and needfinding, however, we found that capturing program output was essential to the experience we wanted to create.
Doing this reliably inside VS Code proved challenging. Extensions do not have a straightforward way to capture all console output, so our initial implementation executed code through the user's local Python environment and captured the results ourselves. This quickly introduced another problem: Python environments are remarkably non-uniform. Different interpreters, packages, paths, and configurations made reliable execution difficult across users.
Because execution output was essential to SPIDER, we eventually moved to a standalone web-based IDE where we could control the execution and data-capture pipeline directly.
The SPIDER interface consists of two primary areas: an IDE and an interactive canvas.
On the left, the IDE uses the Monaco Editor—the same editor that powers VS Code. We chose Monaco in part to give novice programmers an interface resembling the development environments they may encounter later.
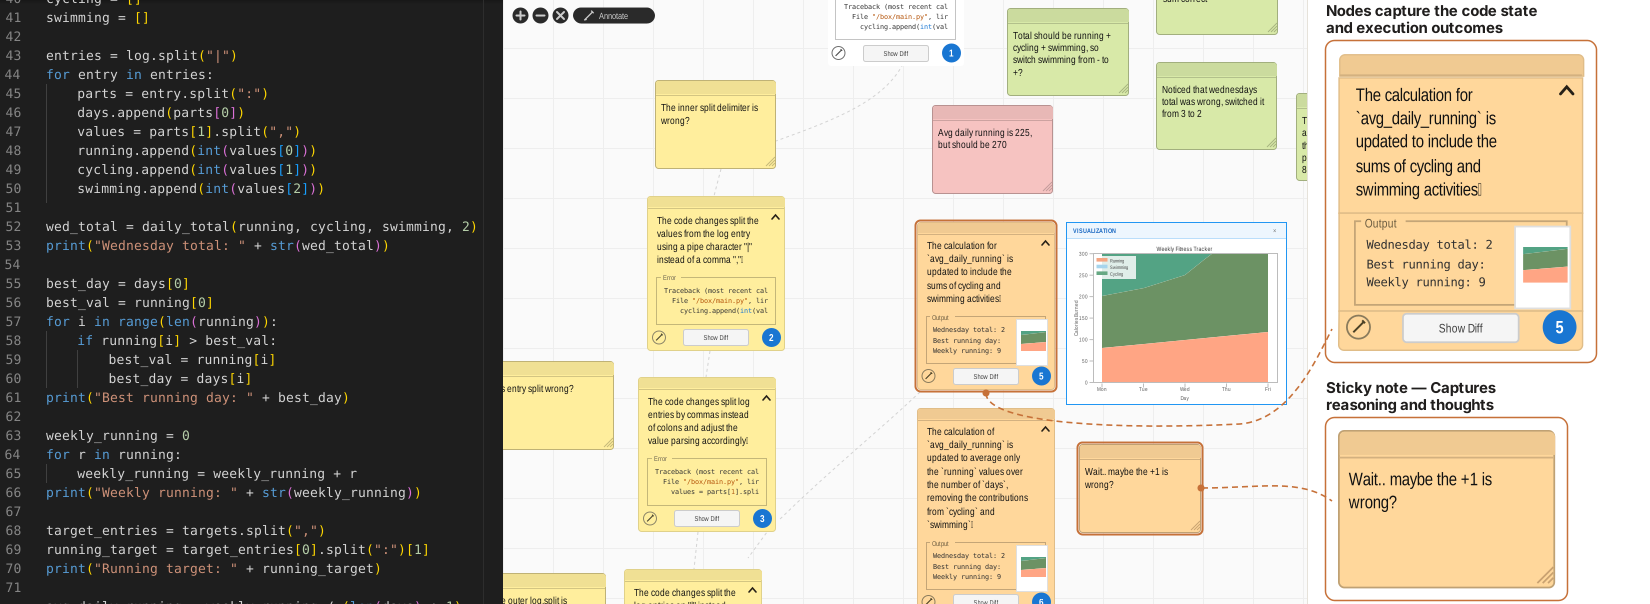
On the right, an infinite canvas is populated with nodes as the programmer works. A node is created when code has changed and is executed, representing a moment when the programmer is testing the result of a change. Each node can preserve the program output, errors, graphical output, code changes from the previous execution, and an AI-generated summary of what changed.
Users can reorganize these nodes freely on the canvas, assign colors, collapse information, and edit the generated summaries. Double-clicking a node restores the project to that earlier code state. From there, the programmer can continue working in a new direction, creating a branch while preserving the exploration they had already tried.
Users can also create sticky notes anywhere on the canvas to record hypotheses, explanations, reflections, or next steps. Together, these features give programmers control over how their debugging history is organized and what information they choose to emphasize.
Projects—including both the code and canvas—can also be shared. SPIDER generates a unique share code that another user can import into their account. Importing creates a copy of the project, preserving the sender's original while allowing the recipient to continue exploring independently.
Architecture
SPIDER uses a serverless architecture hosted through AWS Amplify.
Data is divided between DynamoDB and S3. DynamoDB stores frequently accessed information such as user and project metadata, while S3 stores larger artifacts including code states, graphical output, code diffs, and interaction logs. References to these artifacts are stored in DynamoDB so they can be retrieved when needed.
AWS Cognito handles user authentication and account creation.
Program execution is handled through the OneCompiler API. This architecture allows SPIDER's execution pipeline to support multiple programming languages, although our current work focuses on Python because of its widespread use in introductory programming courses.
Replaying a Debugging Process
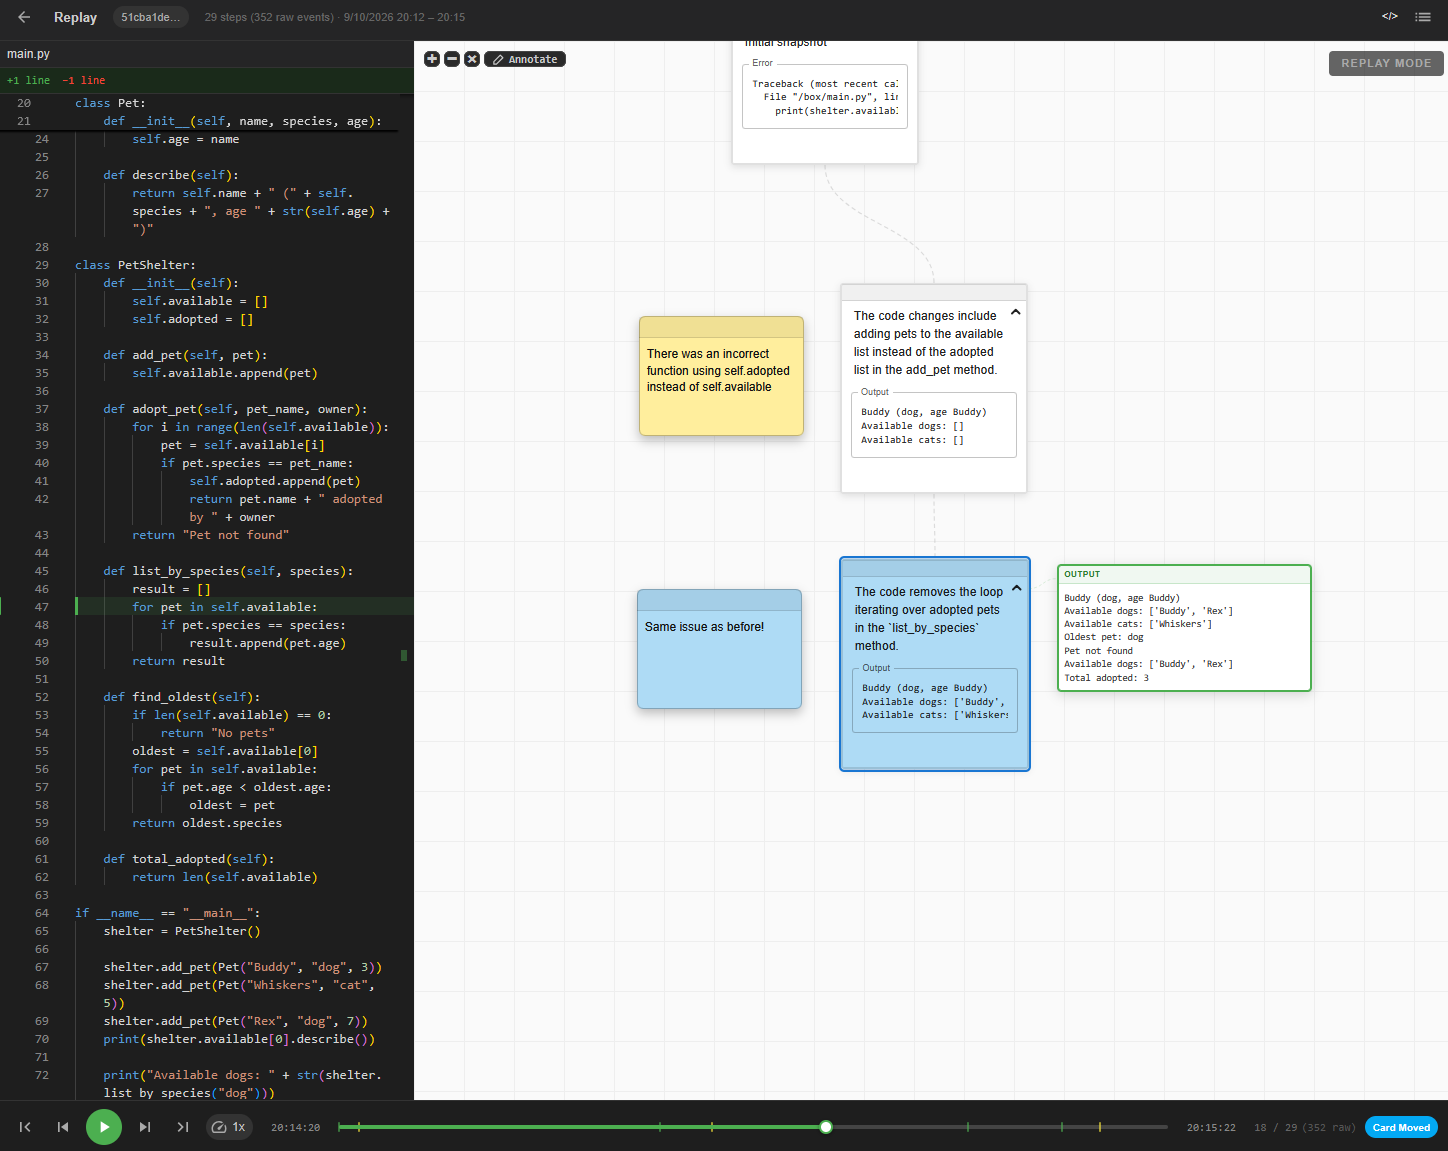
We also developed replay functionality that reconstructs how someone used SPIDER over time. Replay recreates the creation of nodes and sticky notes as well as changes to the canvas, including repositioning elements, editing summaries, writing annotations, and changing colors.
This became particularly important during our first large-scale classroom deployment. The activity occurred approximately two weeks before Spring Break, while interviews took place afterward. Replay allowed participants to revisit what they had done weeks earlier—an eternity in undergraduate time—and talk through their decisions while watching their own debugging process unfold again.
Beyond research interviews, we see replay as potentially useful for instruction. An instructor could work through an example in SPIDER and preserve not only the finished code, but the sequence of changes, errors, explanations, and intermediate decisions that led there. Students could then replay that example later, pause it, move backward and forward, and examine the process at their own pace.
Sharing Debugging Context When Asking for Help
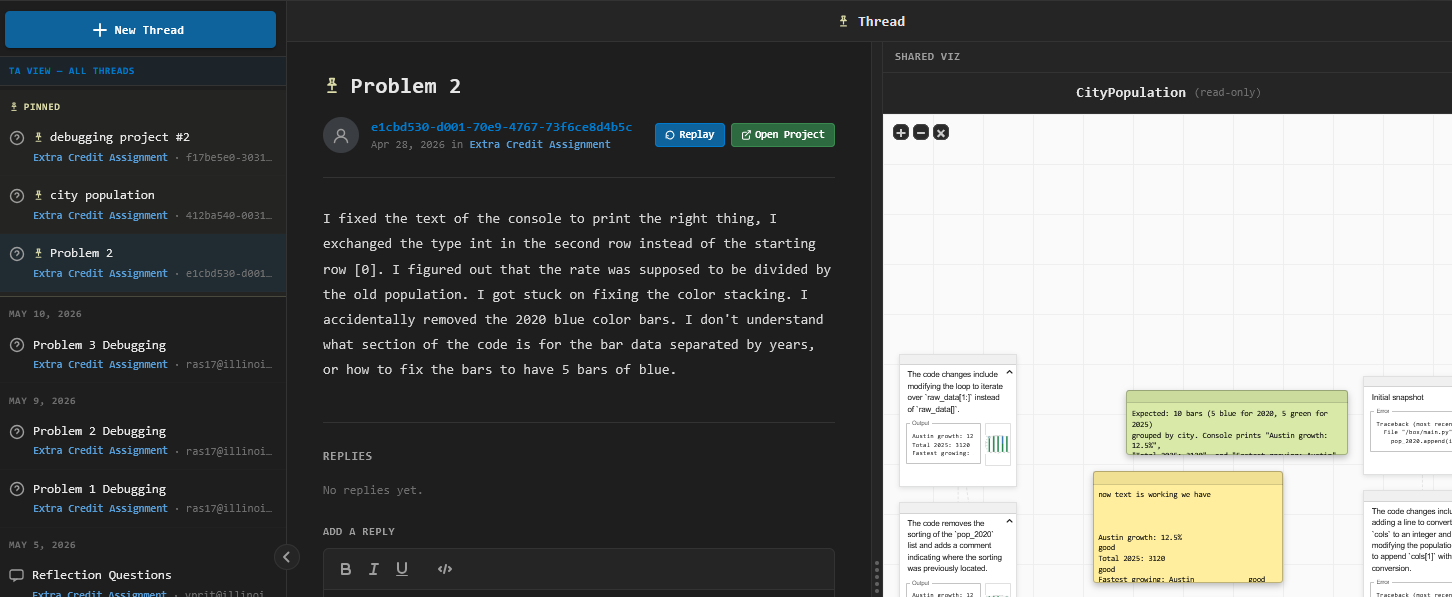
For a subsequent study, we built an online discussion forum directly into SPIDER. The interface mirrors EdStem, the discussion platform already used in the course where we deployed the system, but extends conventional discussion posts by allowing students to attach their SPIDER canvases alongside their questions.
Rather than sharing only their current code and a written description of the problem, students can therefore provide a record of what they have already tried and how they arrived at their current state.
We also added annotation tools that allow users to highlight regions of a canvas, draw directly on it, and add text boxes. We are using these features to investigate what information students choose to emphasize when communicating a programming problem to someone who may help them.
Deployment
SPIDER was deployed in Spring 2026 in an introductory programming course for non-CS engineering majors. Approximately 900 students used the system during the course, giving us the opportunity to study how debugging histories are created, organized, interpreted, and shared at classroom scale.